Web-based data visualization, analytics & reporting studio
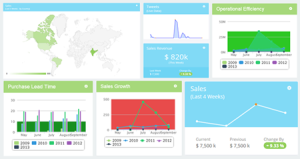
INFORMATIVE DASHBOARDS
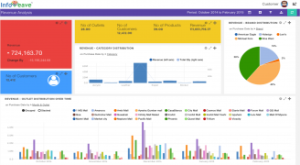
Dashboards help aggregate disparate data sources onto a common platform to enable better data analysis. Infoveave™ allows for personalization of dashboards in your local language and focus on preferred views and widgets. It enables deep dive analysis with the ability to view metrics at a high level of granularity, facilitating better engagement with the target audience.
INTUITIVE ANALYTICS
Reduce the complexity of analytics with our intuitive business-ready widgets. Know your top-selling products, revenue from existing, new and returning customers, percentage of totals, items that represent 80% of variance, MTD, QTD, YTD numbers, periodic growth and much more. Infoveave™’s Workbench has tools such as Pivots, Predictive and What If Analysis that better deciphers your business performance.
INSIGHTFUL VISUALIZATION
Give stakeholders a new perspective to learn how your business is performing by using rich and varied visualizations. Infoveave™ is integrated with an infographic designer that allows you to combine text, images and data visualization to create meaningful and insightful infographics. Publish infographics on websites and social media with periodically updated data to enhance consumer experience.
SELF SERVICE AND FLEXIBLE
Infoveave™’s biggest USP is its ability to analyze out-of-the-box data quickly. Industry-specific KPI packs enable quick adoption and personalize your widgets and dashboards. Share data like never before. Armed with context sensitive help, tours and wizards, Infoveave™ allows you to manage information with limited technical know-how. Export data to other systems to integrate with workflow requirements that businesses demand.
DATA MANAGEMENT
Infoveave™ pulls data from formats like Excel, tsv, csv, JSON, relational, NOSQL and OLAP stores. It integrates well with common open source applications such as Magento, SugarCRM, Google Analytics, NopCommerce, Moodle and Chamilo through custom adapters to enable users a quick start. Infoveave™ gathers data from disparate sources onto a common dashboard, allowing you to correlate information on common dimensions and attributes.
SECURED ACCESS
Infoveave™ has undergone rapid evolution keeping in mind data security and administration. Data being fed into and delivered through the platform is controlled by role and context-based access security. High-level data encryption at the back-end prevents data theft from unwanted or malicious users. Infoveave™ provides businesses a single sign-in with other applications or readily integrate with an organization’s LDAP or Active Directory.
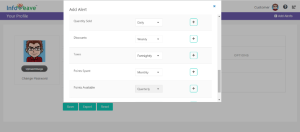
ALERTS AND WORKFLOW
Built on powerful algorithms, Infoveave™ performs complex what-if analysis through accurate data discovery. Infoveave™’s engine correlates metrics for enhanced predictive analysis, giving you insightful information to anticipate outcomes, identify owners for KPIs and track performance. You can integrate most applications with Infoveave™ and set alerts for variances on pre-set parameters.
RESPONSIVE AND MOBILE
Access Infoveave™ from smart devices like smart phones, tablets or smart TVs. The interactive UI enables ease of usage with the flexibility to connect to the platform from virtually anywhere and most importantly, with no effect on performance. The visual experience of the platform on any smart device is as mesmerizing as it is on a desktop or laptop. The reports and dashboards are designed to fit on any screen size.
ENHANCED REPORTING
Infoveave™ makes reporting easy due to its integration with MS Office, allowing you to push data and visualizations to PowerPoint, Word or Excel templates that suit your needs. Email information through Infoveave™’s MS Outlook integration. Upload designed reports and schedule them through a seamless, easy-to-use interface. Automatically update data before sending reports to stakeholders.
How Infoveave™ works
GATHER & STRUCTURE YOUR DATA
READY-TO-USE INDUSTRY TEMPLATES
Structure your data using our ready-to-use industry templates. These templates have pre-defined measures, dimensions, aggregations, KPIs and metrics to suit your specific requirements. Update the template with your data and upload into Infoveave™.
VISUALIZE YOUR PERFORMANCE

There is no better way to communicate information than doing so visually. With the support of visual widgets, Infoveave™ aims to provide the most apt data visualization that is best suited to your needs. From simple text, line, bar and pie charts to the more complex Vornoi, Heatmap, Sunburst, Circle Packing, and Alluvial, Infoveave™ combines data visualization and your analysis to clearly highlight actionable information visually.
CREATE YOUR OWN STRUCTURE
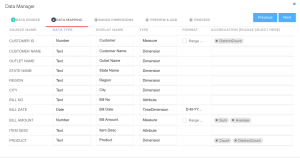
Create a data structure from a sample CSV/TSV format using Infoveave™. Follow the intuitive wizard to create the data structure and identify measures, dimensions and aggregations needed. Save and upload your data.
Use a combination of data sources without the need for manual merges. Ensure that your data is clean and up-to-date before loading. If you need any assistance in data cleaning, get in touch with Infoveave™ Data Services.
ANALYZE, VISUALIZE, GOVERN
ANALYZE YOUR BUSINESS PROBLEMS
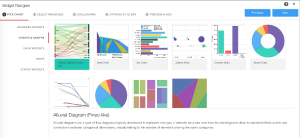
Analyze your data using pre-defined business widgets and popular charting options. Perform in-depth ABC Analysis, Pareto Analysis, Survival Analysis and more. Gain access to KPIs such as revenue from existing, new and returning customers, percentage of totals, top 5s and bottom 5s, and periodic growth. Infoveave™’s Workbench tools such as Pivots, Predictive and What – If Analysis provides a bird’s eye view of your business performance.
VISUALIZE YOUR PERFORMANCE
There is no better way to communicate information than doing so visually. With the support of visual widgets, Infoveave™ aims to provide the most apt data visualization that is best suited to your needs. From simple text, line, bar and pie charts to the more complex Vornoi, Heatmap, Sunburst, Circle Packing, and Alluvial, Infoveave™ combines data visualization and your analysis to clearly highlight actionable information visually.
MANAGE BUSINESS THROUGH METRICS
Schedule and share business performance reports with powerful narratives through graphical visualizations. Use historical trends to evaluate and govern business performance and trends. Set up thresholds and get alerts for key business events (10% sales dip or 15% dip in last quarter earnings). Apply predictive and what-if techniques on historical data to understand business impact.
Infoveave™ supports various deployment options to suit your business needs
Infoveave™ supports accelerated adoption and implementation of an organization’s BI strategy. We understand that organizations work with tight budgets and timelines. That’s why we have kept our licensing options simple and cost effective to help organizations realize their ROI faster. With a range of licensing options, working with us is so much easier. Below are the licensing models we offer:
OWNED
This is the traditional ‘on-premise’ perpetual licensing with data securely residing on your IT infrastructure. Customize, deploy, calibrate and start analyzing your data in a few clicks and see the difference.
- Industry ready starter packs
- On-premise deployment
- Multiple data source mapping
- Perpetual licensing with AMC from the second year
- Choice to upgrade to fully serviced model anytime
SERVICED
This is for organizations with niche requirements or those that would like to use Infoveave™ for BI adoption. It also enables organizations to implement a roadmap and provide services to manage the platform.
- Data is fully managed, cleansed, fixed and uploaded by experts.
- Dashboards are ready to be used every business day.
- Ad-hoc queries and requests for reports fulfilled with defined TATs.
COLLABORATIVE
Got an idea? Build or incorporate it using the power and intellect of the Infoveave™ platform. Get the best out of your applications and ideas by building or enhancing them based on the concept of “Your Intellect, Our Platform”.
- Industry-ready starter packs.
- On-premise deployment.
- Multiple data source mapping.
- Perpetual licensing with AMC from second year.
- Choice to upgrade to fully serviced model anytime.
SUBSCRIBED
Cut down on your organization’s capital expenditure without compromising on quality. Bring in the power of cloud and mobile computing into your BI adoption. Reduce costs and realize ROI at a faster rate!
- On-demand SaaS-based model
- Self-service BI
- Restricted to ‘MS Excel’ or ‘CSV’ compliant data sources
- Annual subscription with user-based licensing model
- No ownership charges
Get actionable insights to manage your business efficiently. While Infoveave™ is completely self-service, get in touch with us for Infoveave™ Consulting / Implementation Services.